Coverage snapshot
Every pull request must keep coverage above the guardrails below. The dashboard lives in a Next.js monorepo, so enforcing this baseline protects dozens of shared components and hooks.
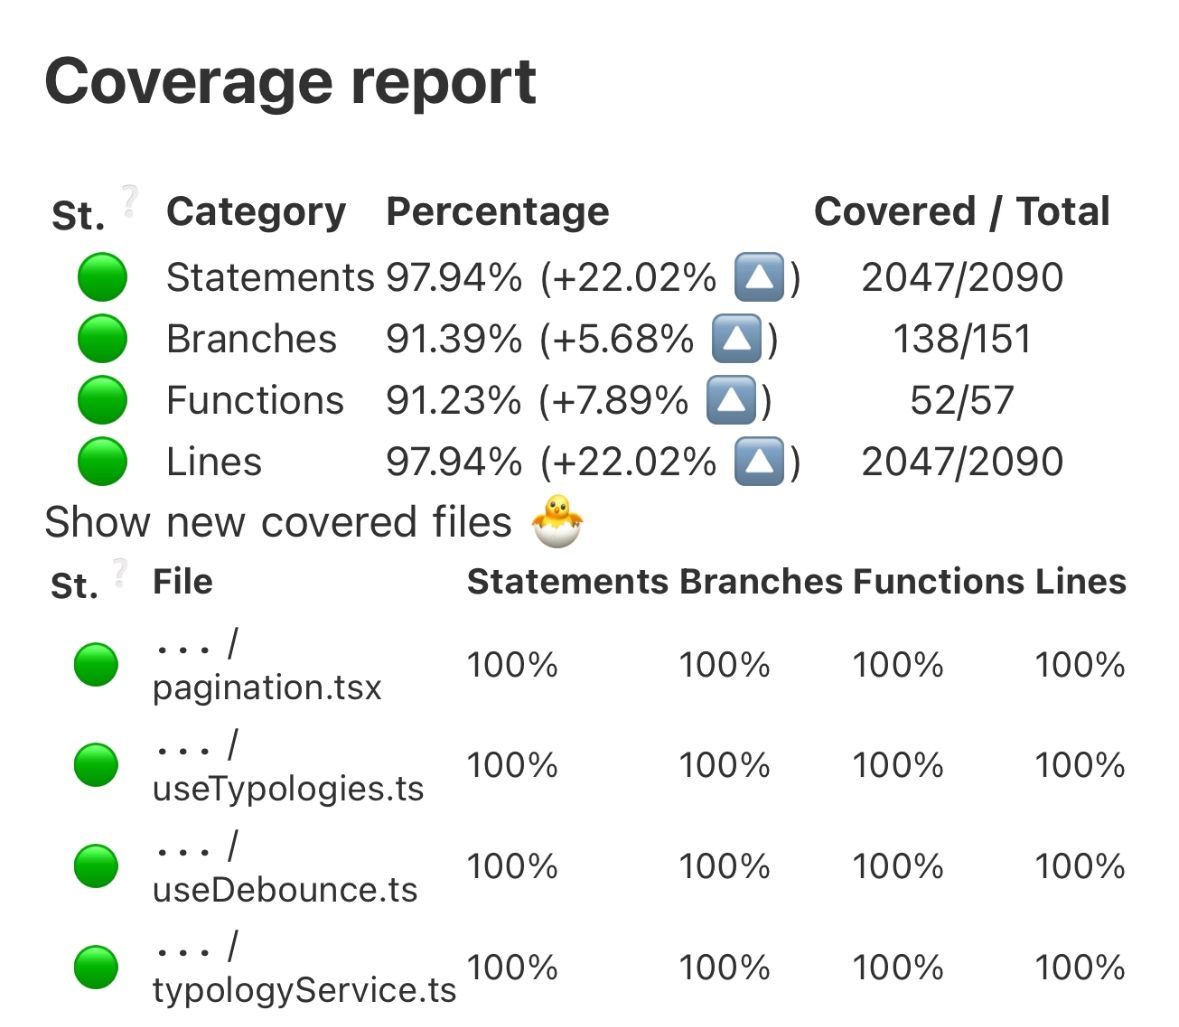
Statements
97.9%
Branches
91.3%
Functions
91.2%
Lines
97.9%
These numbers mean almost every branch—loading, empty, slow, error—is executed by automated tests before a release.
How I enforce it
- Unit tests for shared utilities, selectors, and hooks using Jest + ts-jest.
- Component tests with React Testing Library to lock down pagination, filters, and debounced search.
- MSW API mocks stress slow responses, 500s, and malformed JSON so the UI never regresses on edge cases.
- GitHub Actions blocks merges when coverage drops and leaves inline summaries on each PR.
- Nightly Playwright smoke suite runs against preview builds to catch real-browser issues.
Command used locally: npx jest --runInBand --coverage --coverageThreshold '{ "global": { "statements": 0.95, "branches": 0.85 } }'
Impact
- Refactors of the reporting table shipped with zero regressions across six releases.
- Coverage gate prevented three bugs from reaching production within the first month.
- New engineers can ship confidently because baseline scenarios are already codified.